1271

The 1st case of thrombosis
First case of thrombosis described in the literature. A Franciscan monk, GUILLAUME DE SAINT PATHUS reported symptoms characteristic of deep vein thrombosis (worsening oedema and pain in the right calf spreading to the thigh) in a young Norman cobbler, Raoul.
1856
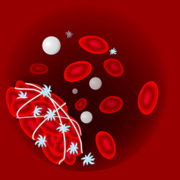
The Virchow's Triad
The German pathologist RUDOLPH VIRCHOW, characterises the factors that promote blood clot formation: venous stasis, vascular wall injury, and hypercoagulability. These three features are now referred to as “Virchow’s Triad”.
1867
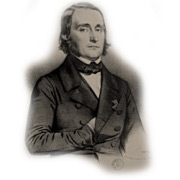
The Trousseau syndrome
ARMAND TROUSSEAU, a French doctor and politician, describes the frequent association between thrombosis and cancer, from which he later suffered himself. Today “Trousseau’s syndrome” denotes the development of multiple thromboses at various sites before discovery of the tumour.
1916
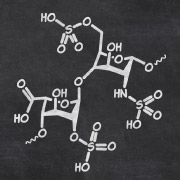
The Heparin
Jay Mc Lean isolates and identifies molecules with anticoagulant properties from dog liver extract, which he names HEPARINE The anticoagulant isolated independently by Maurice Doyon in 1911 also proved to be heparin.
1931

The vitamin K antagonist
An American vet observes a large number of deaths through bleeding in cattle that had eaten mouldy sweet clover. The DOCTOR KARL LINK and collaborators identify the molecule responsible in this clover: dicoumarol, the antidote for which is vitamin K.
1939

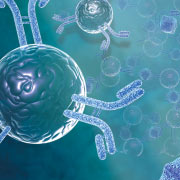
The anti-thrombin
First descriptions, by Tage Astrup of a physiological anticoagulant protein, the effect of which is 2000 more potent in the presence of heparin. It was successively named “pro-antithrombin”, “antithrombin III”, and nally“ANTITHROMBIN”. However, its de cit is described in 1965 by Olav Egeberg.
1960
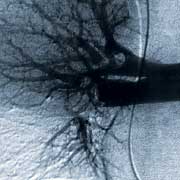
The angiography - The scintigraphy
Pulmonary ANGIOGRAPHY and VENTILATION/PERFUSION SCANNING enter into clinical practice. Before the advent of these investigations, pulmonary embolism was mainly diagnosed... after the patient’s death.
1970

The proteins C and S
Discovery of two physiological inhibitors of coagulation, proteins C and S. The first, discovered by Jan Stenflo, was arbitrarily named PROTEIN C because it was the third molecule he examined in his protocol, and PROTEIN S, identified by Richard DiScipio, was so named because it was discovered in Seattle.
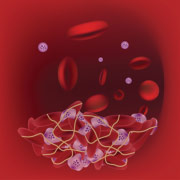
1980
The D-Dimer
The D-Dimer measurement is proposed as exclusion test for DEEP VENOUS THROMBOSIS and PULMONARY EMBOLISM.
1993

The factor V Leiden
Discovery by Björn Dalhbäck of a mutation in the gene for coagulation factor V that promotes thrombosis. It was named after the town in the Netherlands where it was discovered: the FACTOR V LEIDEN mutation.
2001

Thrombosis and air travel
WHO recognises the association between THROMBOSIS AND AIR TRAVEL. The likelihood of developing deep vein thrombosis doubles after a flight of about 4 hours in patients at increased risk.
2008
The direct oral antigoagulants
A new class of anticoagulant drugs are introduced on the market alongside heparins and vitamin K antagonists: THE DIRECT ORAL ANTICOAGULANTS.
2011

The thrombin generation test
Created in 1953 in Oxford, the thrombin generation test (TGT) is being updated. The TGT is a functional test exploring coagulation in its entirety, thus constituting a modern exploration path of hemostasis.
2015
The venous thromboembolism
Venous thromboembolism is the 3 LEADING CAUSE of cardiovascular death (behind myocardial infarction and stroke) and the LEADING CAUSE of preventable hospital deaths.